Event Legend#
Tracks#
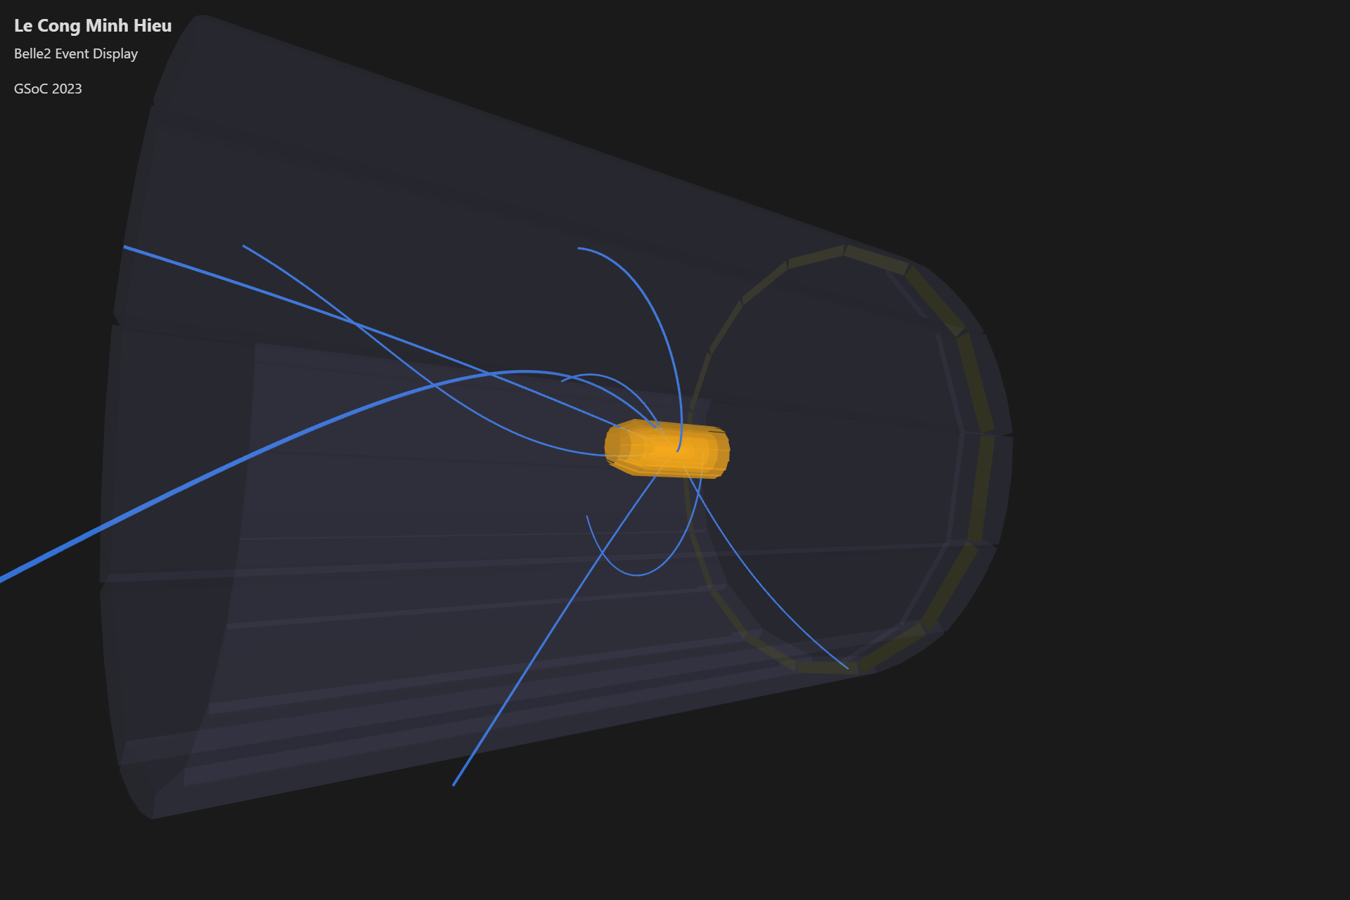
Fig 1. Tracks#
Conventionally, the tracks are represented as continuous lines with the color blue (#336FD1). When zooming in to the size of the SVD, the track lines will become thinner to avoid overlap among them.
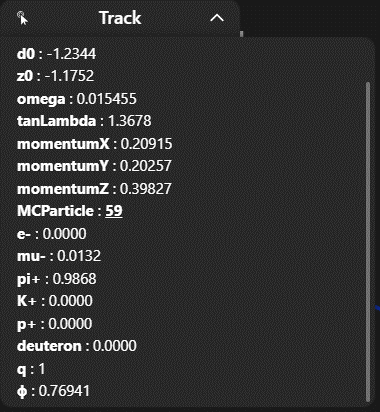
Fig 2. Track Information#
The displayed track information includes helix parameters, momentums, charge, and probabilities for PIDLikelihoods. Additionally, it provides a link to the corresponding MCParticle (with an associated index shown). Clicking on the index line allows you to highlight that MCParticle and open its info overlay.
Should I create a table for this case?
MCParticles#
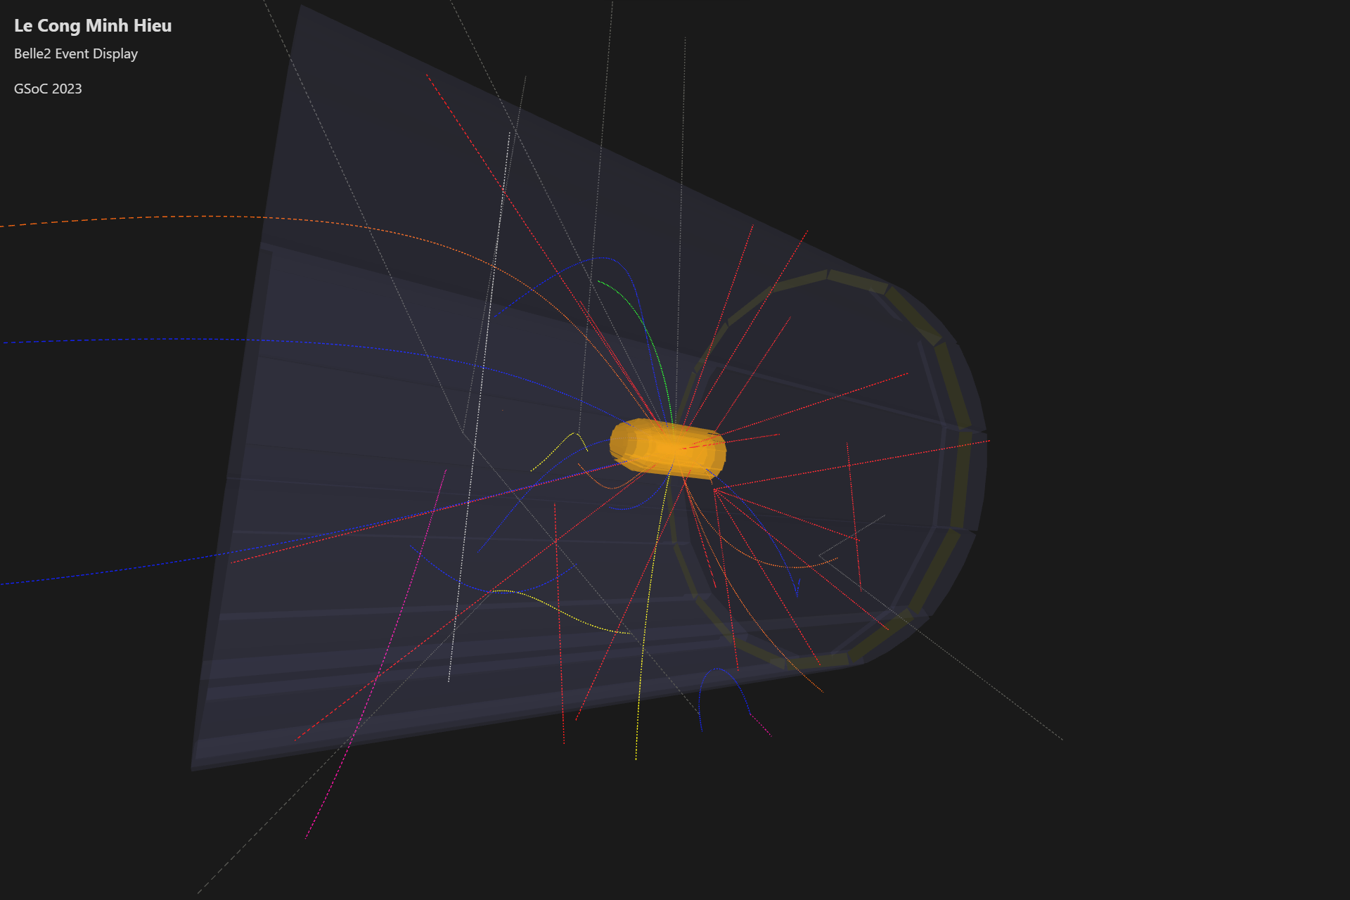
Fig 3. MCParticles#
The trajectories of MCParticles are represented as dashed lines, with colors depending on the particle type. The conventional color dependencies for particle types are as follows:
pion: blue
kaon: green
proton: magenta
deuteron: cyan
electron: orange
muon: yellow
photon: red
neutrino: dark grey
neutron, KS, KL, Lambda: light grey
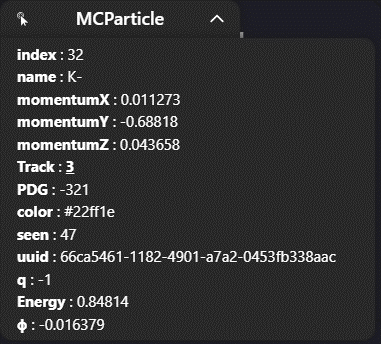
Fig 4. MCParticle Information#
MCParticle information includes particle identities (PDG, name), momentums, energy, and charge. It also includes the related Track index; by clicking on it, you can highlight that Track and open its info overlay.
ECLClusters#
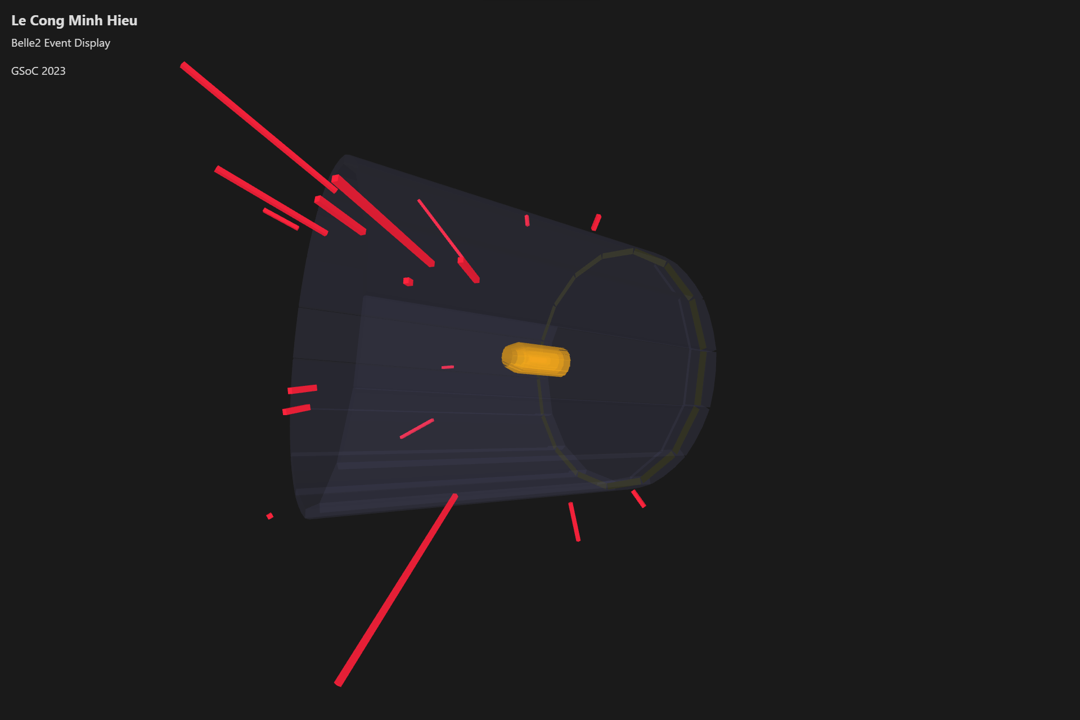
Fig. 5: ECLClusters#
ECLClusters are represented as radial red cubes with lengths proportional to their energy.
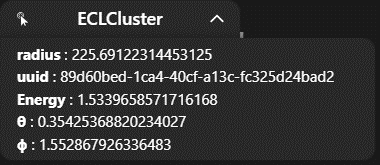
Fig. 6: ECLCluster Information#
The info overlay for ECLClusters includes position parameters and energy.
KLMClusters#
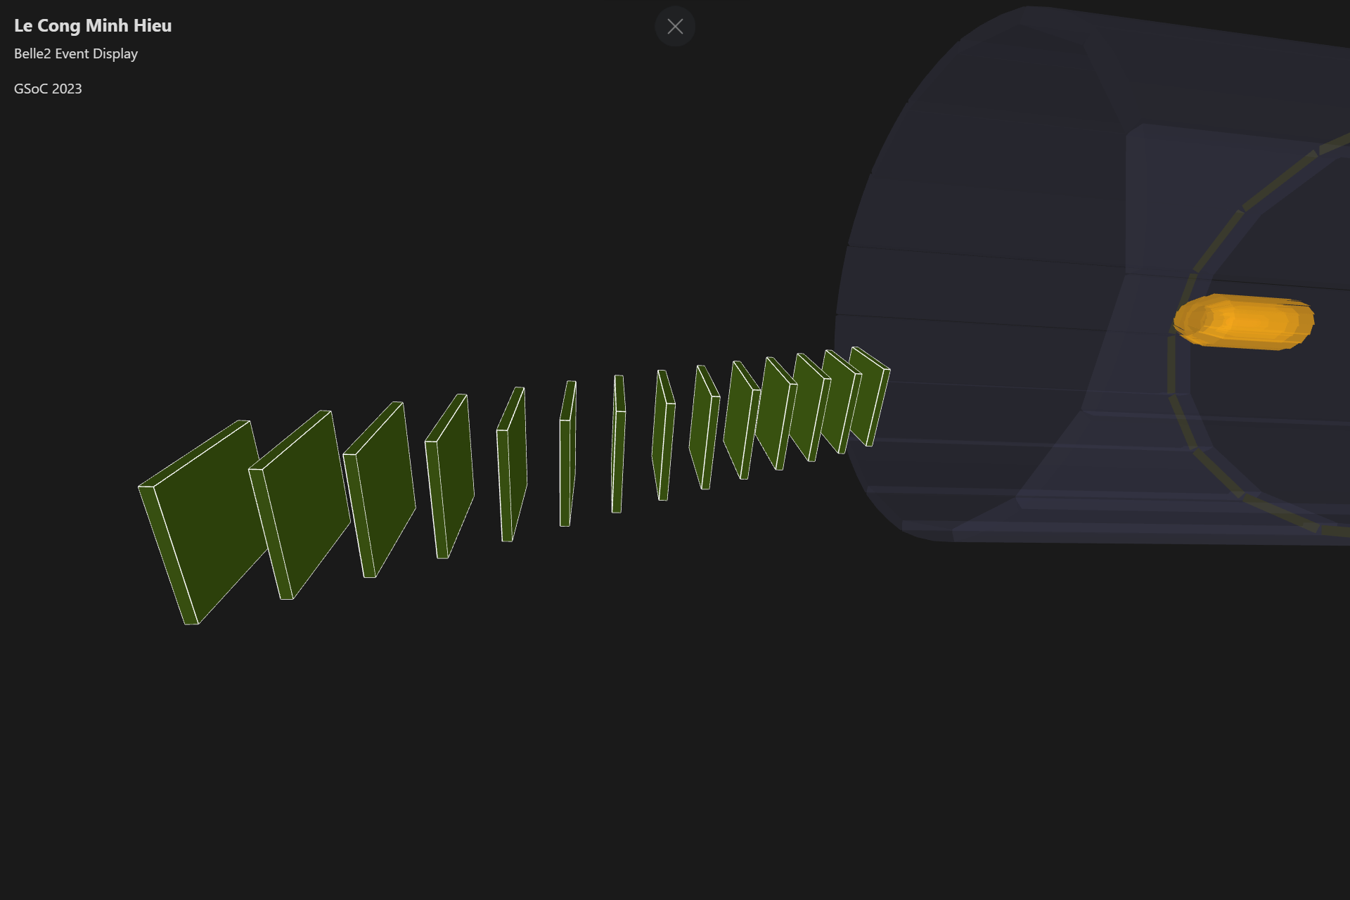
Fig. 7: KLMClusters#
KLMClusters are represented as green cubes arranged in layers.
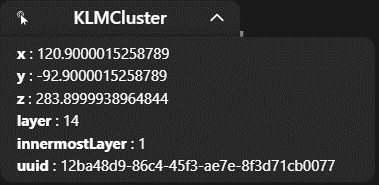
Fig. 8: KLMCluster Information#
The info overlay for KLMClusters includes position parameters and the number of layers.